
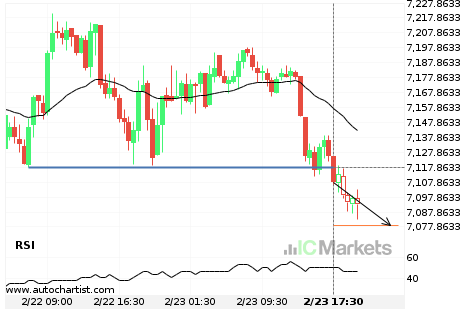
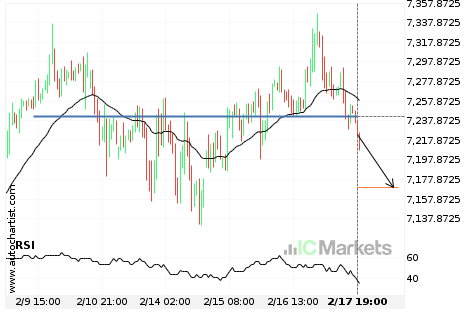
Australia 200 Index – línea de precio psicológico atravesada
El Australia 200 Index atravesó la línea de soporte. Como ya lo hemos visto retroceder desde esta posición en el pasado, deberíamos esperar la confirmación de la ruptura antes de operar. Ha llegado a esta línea en numerosas ocasiones en los últimos 2 días, lo cual sugiere un posible nivel objetivo alrededor de 7078.9038 dentro […]
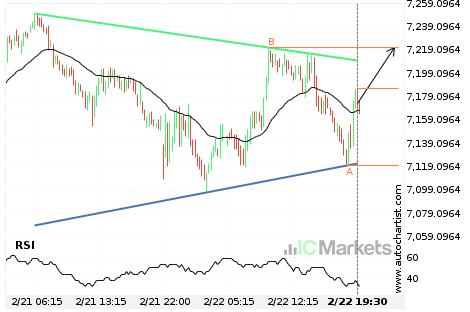
¿Tendrá el Australia 200 Index suficiente impulso como para irrumpir la resistencia?
El Australia 200 Index se dirige hacia la línea de resistencia de un Triángulo y puede alcanzar este punto en las próximas 11 horas. Ha probado esta línea ya en numerosas ocasiones en el pasado, y esta vez no tendría porqué ser diferente y terminar con una recuperación en lugar de una irrupción. Si ésta […]
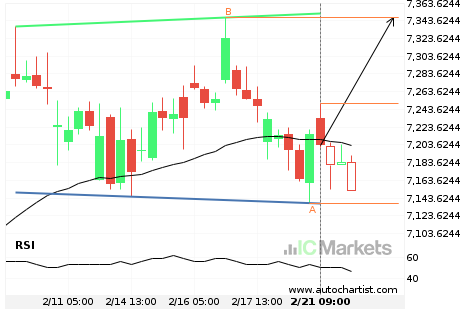
El Australia 200 Index se aproxima a la resistencia de un Bandera
El Australia 200 Index se está acercando a la línea de resistencia de un Bandera. Ha llegado a esta línea en numerosas ocasiones durante los últimos 12 días. Si vuelve a probarla de nuevo, debería hacerlo en las próximas 2 días.
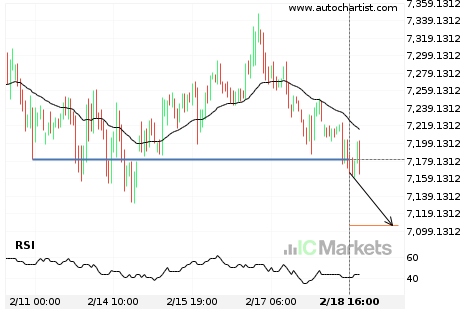
Importante línea de precio atravesada por el Australia 200 Index
El Australia 200 Index ha atravesado 7180.8901, que ha probado ya varias veces en el pasado. Ya hemos visto un retroceso de esta posición en numerosas ocasiones. Si esta nueva tendencia persiste, Australia 200 Index podría dirigirse al nivel 7105.8452 dentro de las próximas 2 días.
Australia 200 Index – línea de precio psicológico atravesada
El Australia 200 Index atravesó la línea de soporte. Como ya lo hemos visto retroceder desde esta posición en el pasado, deberíamos esperar la confirmación de la ruptura antes de operar. Ha llegado a esta línea en numerosas ocasiones en los últimos 9 días, lo cual sugiere un posible nivel objetivo alrededor de 7170.1328 dentro […]
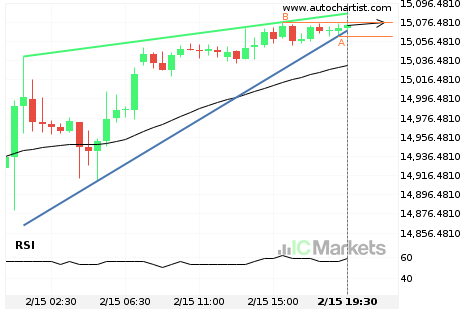
¿Tendrá el FTSE China A50 Index suficiente impulso como para irrumpir la resistencia?
El FTSE China A50 Index se dirige hacia la línea de resistencia de un Cuña ascendente y puede alcanzar este punto en las próximas 5 horas. Ha probado esta línea ya en numerosas ocasiones en el pasado, y esta vez no tendría porqué ser diferente y terminar con una recuperación en lugar de una irrupción. […]
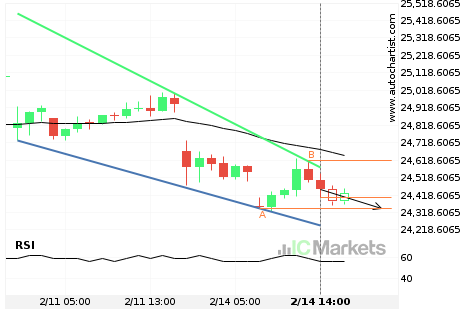
El Hong Kong 50 Index se aproxima a el soporte de un Cuña descendente
El Hong Kong 50 Index se está acercando a la línea de soporte de un Cuña descendente. Ha llegado a esta línea en numerosas ocasiones durante los últimos 4 días. Si vuelve a probarla de nuevo, debería hacerlo en las próximas 6 horas.
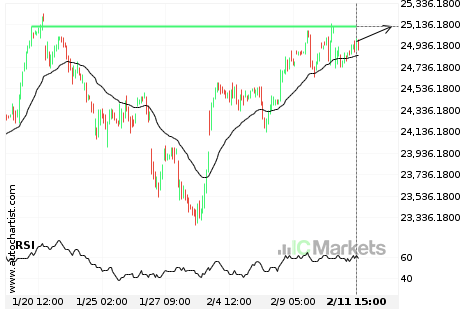
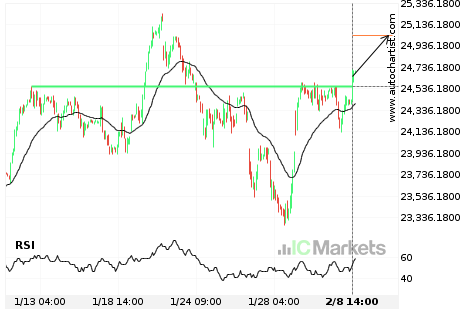
Inminente irrupción de una importante línea de precio del Hong Kong 50 Index
El Hong Kong 50 Index avanza hacia la línea de 25112.9004, que ya ha probado en numerosas ocasiones durante el pasado. Hemos observado un retroceso desde esta posición en el pasado, por lo que en esta fase no está claro si atravesará este precio o se recuperará como ya hizo antes. Si el Hong Kong […]
¿Qué está ocurriendo con el Hong Kong 50 Index?
Aquellos de ustedes que sean seguidores de tendencias probablemente estarán observando ansiosamente Hong Kong 50 Index para comprobar si el último movimiento de un 3,5% continúa. Si no lo hace, las personas fieles al método de reversión a la media estarán encantadas con este excepcionalmente gran movimiento de 2 días.
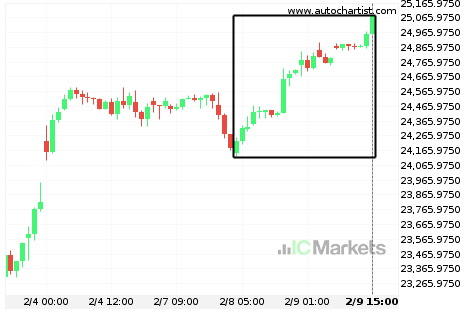
Importante línea de precio atravesada por el Hong Kong 50 Index
El Hong Kong 50 Index ha atravesado 24561.4004, que ha probado ya varias veces en el pasado. Ya hemos visto un retroceso de esta posición en numerosas ocasiones. Si esta nueva tendencia persiste, Hong Kong 50 Index podría dirigirse al nivel 25035.1191 dentro de las próximas 3 días.